


CLIENT MARKET INSIGHT
Midterm Elections & the Stock Market
What history shows about market behavior during midterm election years — and the powerful rally that often follows.
Understanding the Pattern
Every four years, midterm elections reshape Congress. And history shows these years also leave a distinctive imprint on financial markets. Since 1950, the S&P 500 has followed a consistent rhythm: subdued or volatile returns during the midterm election year itself, followed by a notably strong rally in the 12 months that follow. Understanding this pattern can help investors maintain perspective and discipline during periods of political uncertainty.

S&P 500 Returns: Midterm Election Years vs. the Year Following (1950–2022)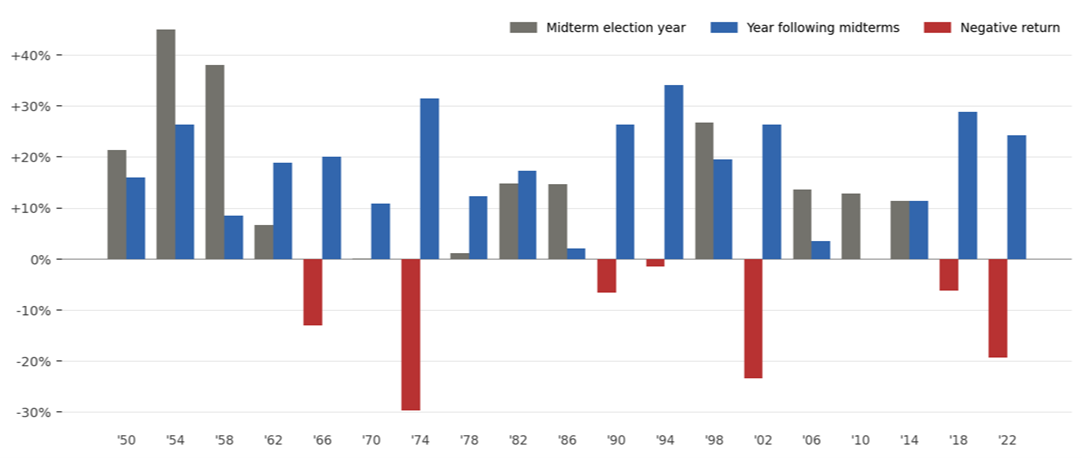
Figure 1. S&P 500 annual price returns for each midterm election year (gray) and the subsequent year (blue). Red bars indicate a negative return. Source: Bloomberg, U.S. Bank Asset Management, RBC Capital Markets.
What the Data Reveals
The chart above illustrates a pattern that has repeated across 19 midterm election cycles since 1950. Midterm election years are often characterized by heightened uncertainty. Investors face an unclear picture of congressional control, potential policy shifts, and the political environment more broadly. This uncertainty has historically weighed on returns, with the S&P 500 averaging just 5.9% during midterm years, compared to the long-run historical average of approximately 10%.1
Once the election results are settled, however, markets have historically responded with notable strength. The average return in the 12 months following a midterm election stands at 16.3% – nearly triple the midterm year average, and well above the long-run norm.2 Analysis of midterm data since 1962 found that the S&P 500 has never posted a negative return in the October-to-October period following a midterm election.3
“The S&P 500 has never posted a negative return in the 12-month period following a midterm election since 1962. The average gain over that window: +16.3%.”
Why Does This Pattern Occur?
Researchers and strategists point to several interconnected reasons:
Uncertainty resolution. Markets dislike uncertainty more than they dislike any particular policy outcome. Once midterm results are known and a new congressional landscape is established, investors can better anticipate the legislative environment and refocus on economic fundamentals – earnings, interest rates, and growth.
Political cycle dynamics. Midterm elections typically occur at a mature point in the economic cycle, often coinciding with a period when presidential administrations pivot toward growth-oriented policies ahead of the next presidential campaign. This shift in political focus has historically coincided with improved market conditions.
Drawdown and recovery. RBC Capital Markets’ analysis found that the S&P 500 declined an average of 20.6% at some point during the 12 months leading up to a midterm election – only to recover those losses and post an average gain of nearly 47% from the midterm-year low to the subsequent year’s high.4
Important Caveats for Investors
Historical patterns are descriptive, not prescriptive. U.S. Bank’s research covering 125 years and 31 midterm elections found that the statistical difference between midterm and non-midterm years does not rise to the level of significance – in part because the sample size is modest and economic factors often dominate political ones.4 The worst midterm years (1974, 2002, 2022) were driven by stagflation, the tech crash, and aggressive Federal Reserve rate hikes – forces entirely independent of the election cycle. The election cycle is a tailwind to be aware of, not a forecast to rely on.
The RISE Perspective
At RISE Wealth Strategies, we believe disciplined, long-term planning matters far more than short-term market timing around political events. The data on midterm election cycles reinforces a foundational principle of sound investing: staying invested through uncertainty has historically been rewarded. If you have questions about how current market conditions intersect with your financial plan, reach out directly to schedule a conversation.
________________________________________________________________
Sources & Notes
1 PFG Private Wealth Management, "S&P 500 Performance During Election Years" (January 2022). Average S&P 500 price return during midterm election years since 1950.
2 RBC Capital Markets U.S. Equity Strategy / Bloomberg, as cited in RBC Wealth Management, "Equities and the Election Effect" (November 2022). Average S&P 500 price return in the year following midterm elections since 1932.
3 E*TRADE / QuantifiedStrategies.com, "S&P 500 Midterm Election Year" (May 2025). Based on the October-to-October period following midterm elections since 1962. The last negative 12-month post-midterm return occurred in 1939.
4 U.S. Bank Asset Management Group Research, "How Midterm Elections Affect the Stock Market" (January 2026). Analysis covers 31 midterm elections over 125 years of market data.
5 Past performance is not indicative of future results. This material is for informational purposes only and does not constitute investment advice or a recommendation to buy or sell any security. Investing involves risk, including the possible loss of principal. The S&P 500 Index is unmanaged and cannot be purchased directly by investors.
The opinions expressed are those of the author and not necessarily those of Guardian or its subsidiaries. Past performance is not a guarantee of future results. All investments and investment strategies contain risk and may lose value. Diversification does not guarantee profit or protect against market loss. Equities may decline in value due to both real and perceived general market, economic and industry conditions. Investing in securities of smaller companies tends to be more volatile and less liquid than securities of larger companies. Investing in the bond market is subject to certain risks including market, interest rate, issuer, credit and inflation risk. This material is intended for general use. By providing this content Park Avenue Securities LLC and your financial representative are not undertaking to provide investment advice or make a recommendation for a specific individual or situation, or to otherwise act in a fiduciary capacity. Indices are unmanaged and one cannot invest directly in an index.
Links to external sites are provided for your convenience in locating related information and services. Guardian, its subsidiaries, agents and employees expressly disclaim any responsibility for and do not maintain, control, recommend, or endorse third-party sites, organizations, products, or services and make no representation as to the completeness, suitability, or quality thereof.
Registered Representative and Financial Advisor of Park Avenue Securities LLC (PAS). OSJ: 6455 SOUTH YOSEMITE STREET, SUITE 425, GREENWOOD VILLAGE CO, 80111, 303-7709020. Securities products and advisory services offered through PAS, member FINRA, SIPC. Financial Representative of The Guardian Life Insurance Company of America® (Guardian), New York, NY. PAS is a wholly owned subsidiary of Guardian. RISE WEALTH STRATEGIES is not an affiliate or subsidiary of PAS or Guardian. CA Insurance License Number - 4100103. 8853646.1 Exp. 4/28